

DATA UNDER TRUMP 2025
Short (1.5 ish sentence) summary of article
A rally protesting Trump's Muslim travel ban back in 2017.
Alba Vigaray/EPA/REX/Shutterstock
Last updated February 25, 2025 xx:xx pm (EST)
Background
This data was pulled from US Customs and Border Patrol Website at the following link on January 28, 2025 and updated with data pulled on March 18, 2025.
This set of graphs shows irregular migration patterns around US northern and southern borders, as revealed by Customs and Border Patrol Data collected between October 2019 - February 2025. This is a large administrative dataset collected by the federal government. It does not include: 1) Individuals who possess a visa and present this document upon entry. 2) Individuals who cross the border irregularly but are not apprehended by a federal agent. This data is difficult to estimate due to these individuals’ inability to participate in welfare systems and typical nonresponse to respond to surveys due to their lack of legal status in the United States. For more information on estimation limitations and techniques for these populations see here.
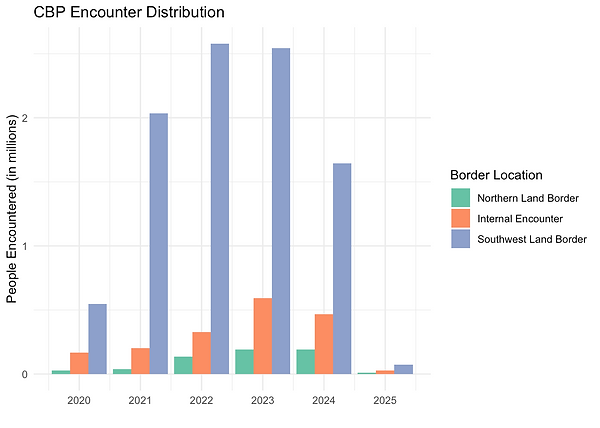
In this CBP dataset, encounters refers to official apprehensions of migrants without legal status by federal agents. Most encounters occur at the Southwest border. Internal Encounters occur at other ports of entry that are not a land border. These can include airports, train stations, maritime ports, etc. Encounters at the Northern border have been rising over the past few years, but still are far below the number of encounters at the Southwest border. The date range has been limited to 2020-2025, due to the incomplete data for the 2019 calendar year. 2025 data is available for January and February.

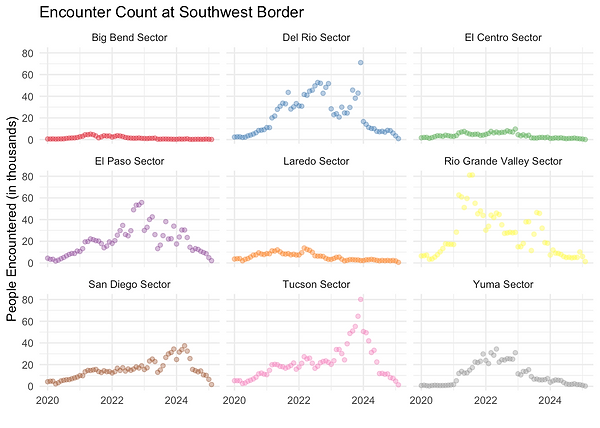
The next graph shows the number of encounters by sector of the southern border from 2020 - 2024. To better understand this data, please also see the map that shows the area each border sector controls here:
Sectors with high spikes are highlighted to see trends over time, while sectors that maintain at relatively the same level through this time period are all in grey.

Another way to look at this data is to look at each sector separately
Different trends appear at the Northern Border.

More recently, encounters at the Southern Border have decreased from highs in the second half of 2023.

Mexican citizens have the most encounters with CBP agents, more than three times the next country. When Mexico is excluded, the resulting top 10 nationalities apprehended at the border are all from Central and South America.

